14 Sep 2026
Interface Components Linked to Retention Patterns in Live Event Betting Platforms
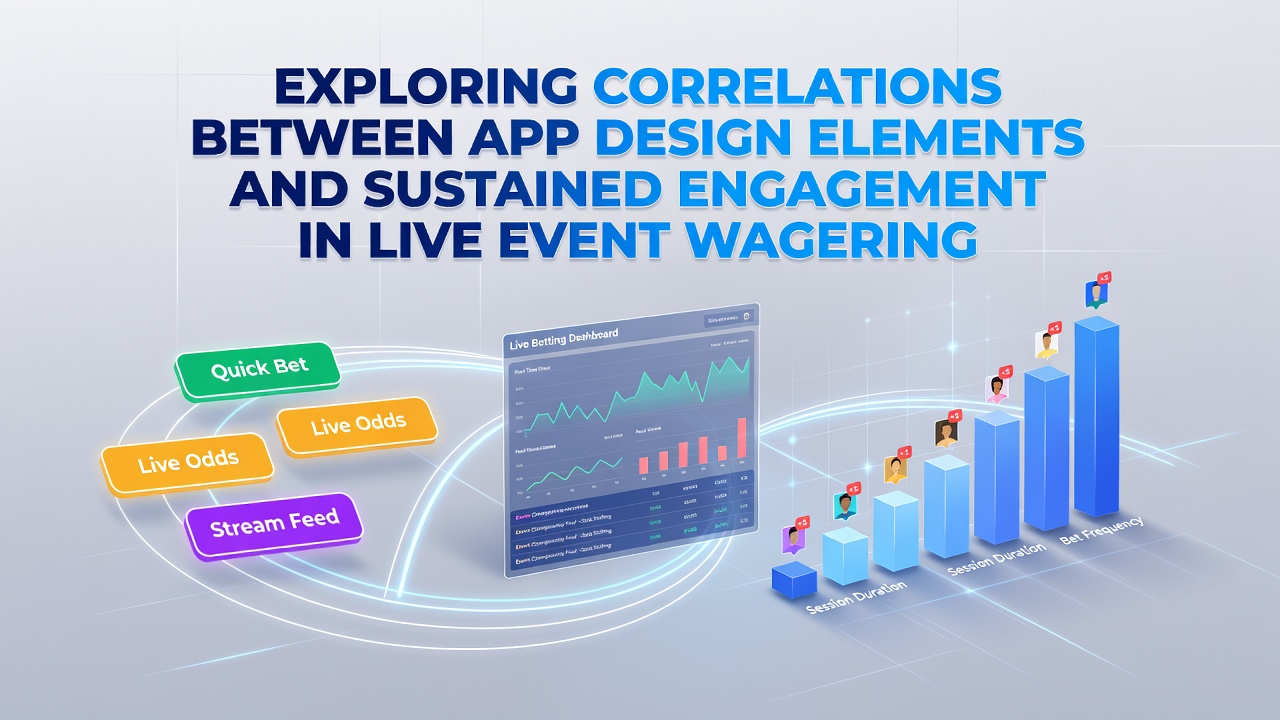
App design elements play measurable roles in how users interact with live event wagering platforms over extended periods, according to multiple industry analyses and user behavior studies conducted across various markets. Navigation structures, color schemes, loading speeds, and notification systems each connect to different levels of session duration and repeat visits, with data compiled from platform analytics showing consistent trends in user activity logs.
Core Design Elements Under Examination
Researchers track several variables when evaluating mobile interfaces for live betting applications, including button placement for rapid wager placement, real-time score overlays that update without full page refreshes, and menu hierarchies that reduce the number of taps required to access event markets. Data from platform metrics reveals that streamlined access to in-play options correlates with longer average session times, while cluttered layouts show shorter engagement windows in aggregated reports. Visual hierarchy matters as well, since larger fonts for odds and high-contrast backgrounds help users process information quickly during fast-moving events.
Animation effects and transition smoothness also factor into retention figures, because studies of user flow demonstrate that excessive motion can increase bounce rates whereas subtle feedback animations maintain attention without distraction. Push notification frequency ties directly to return visits, with evidence indicating that personalized alerts about specific events outperform generic messages in sustaining activity across weeks or months.
Regional Data Trends and Measurement Approaches
Analytics firms collect information through heatmaps, session recordings, and A/B testing protocols that isolate individual components like search bar positioning or filter options for leagues and teams. In September 2026, aggregated figures from North American and European markets showed that platforms optimizing for one-handed navigation recorded higher completion rates for multi-leg bets during live matches. Observers note that these patterns hold across different device types, though tablet users exhibit slightly different preferences for expanded side panels compared with smartphone users who favor bottom navigation bars.
Industry organizations such as the Responsible Gambling Council have compiled reports linking interface clarity to reduced user frustration during peak event periods, while separate academic work from Canadian institutions examines how color psychology influences decision speed in wagering contexts. Government agencies in Australia have released comparable datasets that track how loading times under two seconds connect to sustained participation rates throughout entire tournaments.
Case Examples from Platform Testing
One testing sequence examined three variants of a live tennis betting screen, where the version featuring persistent score tickers alongside collapsible bet slips produced measurably higher repeat engagement over a four-week trial period. Another evaluation focused on cricket applications during international series, revealing that integrated video thumbnails next to odds improved session length by allowing users to monitor action without switching apps. These outcomes emerged from controlled experiments that held marketing campaigns constant while varying only the visual and functional elements.
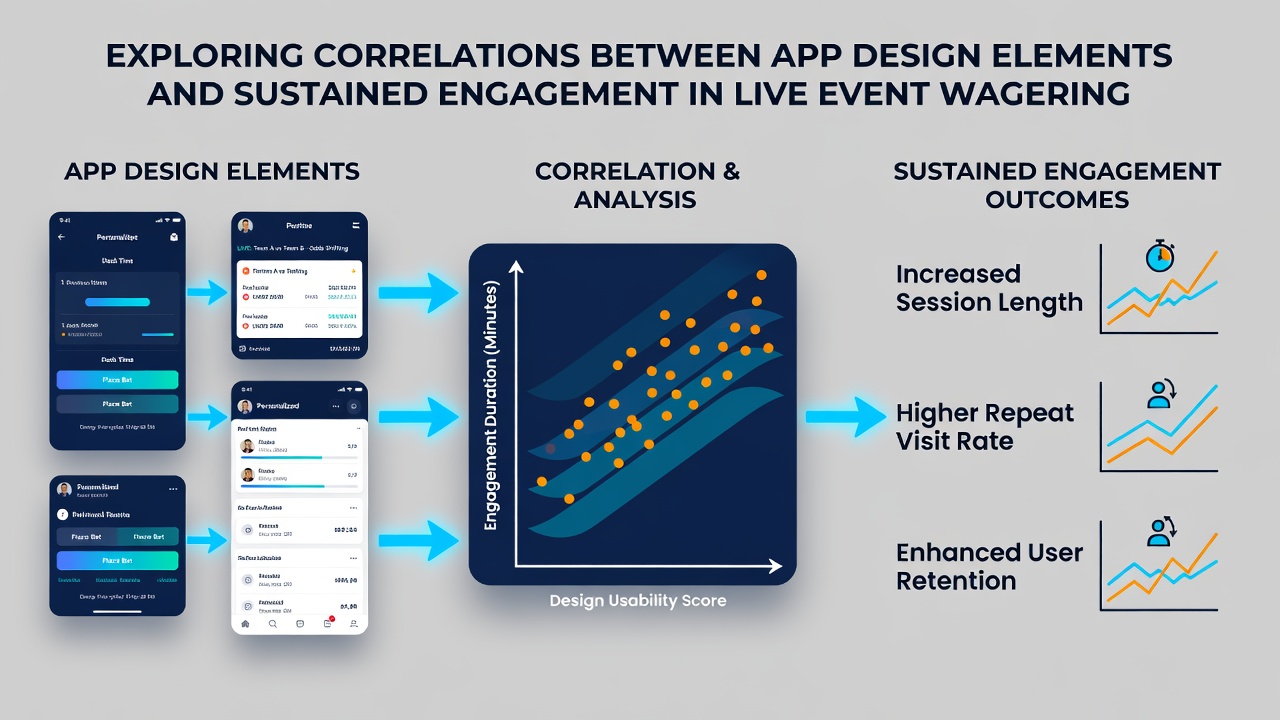
Payment integration design also surfaces in retention studies, since one-click deposit flows positioned within the main betting flow reduce interruptions that otherwise lead users to exit mid-event. Security indicators displayed prominently near transaction buttons appear in multiple datasets as factors that maintain trust levels and prevent drop-offs during high-stakes moments.
Measurement Challenges and Ongoing Research
Establishing direct causation remains complex because external variables such as event popularity and promotional timing influence outcomes alongside interface choices. Researchers therefore rely on multivariate regression models that account for these factors while isolating design contributions. Trade groups including the European Gaming and Betting Association continue to fund projects that refine these models, producing updated benchmarks each quarter that help platforms refine layouts based on fresh user cohorts.
Device compatibility testing adds another layer, since operating system updates can alter how design elements render and thereby shift engagement statistics unexpectedly. Teams monitor these shifts through continuous data pipelines that flag deviations within days rather than weeks, allowing rapid adjustments to maintain consistent user experiences.
Conclusion
Evidence gathered from diverse testing environments points to clear associations between specific app design choices and patterns of sustained engagement in live event wagering. Navigation efficiency, visual feedback mechanisms, notification strategies, and transaction flows each demonstrate measurable connections to session duration and return frequency when examined through controlled studies and large-scale analytics. Continued refinement of these elements relies on ongoing data collection from multiple regions and device ecosystems, with results informing iterative improvements that align interface performance with observed user behavior across different event types and time zones.